


- What it measures: THC percentage is the concentration of THC by dry weight of the product — not potency of the high, not quality.
- Flower range: Commercial flower typically tests between 15% and 35% THC. Average in licensed US markets is 18–25%.
- Lab variation: Studies find THC measurements vary by up to 25–30% across different accredited labs testing the same sample.
- Higher is not better: Experienced consumers frequently prefer 18–25% flower with rich terpenes over 35% with sparse terpene content.
- Product type matters: 30% THC flower, 80% THC vape cartridge, and 10mg edible are not comparable; bioavailability differs dramatically.
- Beginner guidance: Start below 15% flower or 2.5mg edible THC, regardless of what the dispensary recommends.
What Does THC Percentage Actually Measure?
THC percentage on a cannabis product label represents the concentration of delta-9-tetrahydrocannabinol by dry weight of the material. For flower, this means grams of THC per 100 grams of dried cannabis. A product labeled 22% THC contains approximately 220 milligrams of THC per gram of flower. This is a chemical measurement of concentration, not a direct measure of the intensity of the effect you will experience.
The distinction matters because THC percentage alone does not account for: how efficiently you consume the product (smoking vs vaporizing vs edibles); your individual tolerance; the presence of CBD (which modulates THC effects); the terpene profile (which shapes the character of the experience); or the moisture content of the flower (drier flower tests higher by percentage because the denominator — dry weight — is lower).
Labels often show THCA rather than — or in addition to — THC. THCA (tetrahydrocannabinolic acid) is the inactive precursor to THC present in raw, unheated cannabis. It converts to THC through decarboxylation (heating). When you smoke or vaporize, THCA becomes THC. A label showing 24% THCA will produce approximately 21% THC after decarboxylation (using the conversion factor of 0.877). Total potential THC is sometimes expressed as Total THC = THC + (THCA × 0.877).
Does Higher THC = Better?
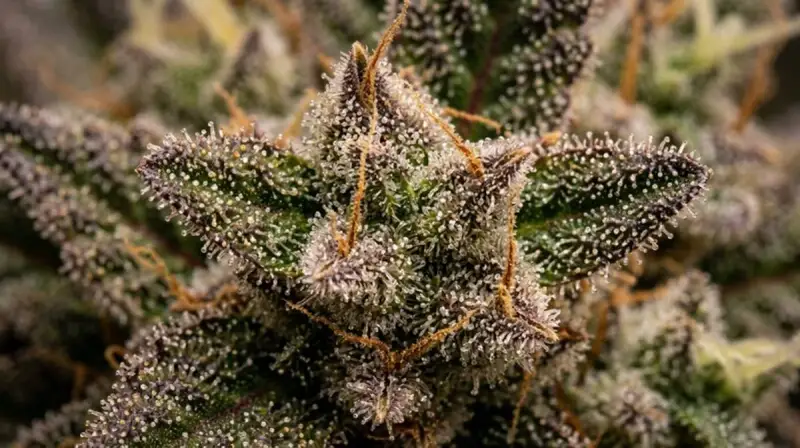
The short answer is no — and this misconception is one of the most commercially damaging beliefs in cannabis consumer culture. The market fixation on maximum THC percentage has pushed breeders and producers toward genetics optimized for a single metric at the expense of overall quality. A strain bred for 35% THC often has a sparse terpene profile, because the same biological resources in the trichome that could be devoted to terpene production are redirected toward maximizing THC output.
Experienced cannabis consumers consistently report preferring well-rounded 18–25% strains with complex terpene profiles over stripped-down 30%+ products. The subjective experience — the quality of the high, its duration, its emotional character — is shaped by the full cannabinoid and terpene matrix, not by THC alone. This is the practical expression of the entourage effect.
From a consumer protection perspective, there is also the problem of diminishing returns. Regular consumers develop CB1 receptor tolerance to THC over time. Above a certain individual threshold, additional THC primarily increases the risk of adverse effects (anxiety, paranoia, cognitive disruption) rather than adding positive effects. Many experienced users who began consuming high-THC products report better satisfaction after deliberately lowering potency and selecting for terpene profile instead. For medical cannabis patients, consistent moderate dosing typically outperforms occasional high-dose use.
THC Potency by Product Type
Potency is expressed differently depending on the product category, and raw percentages are not directly comparable across product types due to differences in bioavailability and delivery mechanism.
| Product Type | Typical THC Range | How Measured | Bioavailability |
|---|---|---|---|
| Flower | 15–35% | % by dry weight | ~25–35% (smoked); ~40–50% (vaporized) |
| Vape Cartridge | 70–90% | % of oil concentrate | ~50–70% |
| Edibles | 2.5–100 mg per serving | mg per serving / package | ~10–20% (highly variable) |
| Concentrates (dab) | 60–95% | % total cannabinoids | ~50–75% |
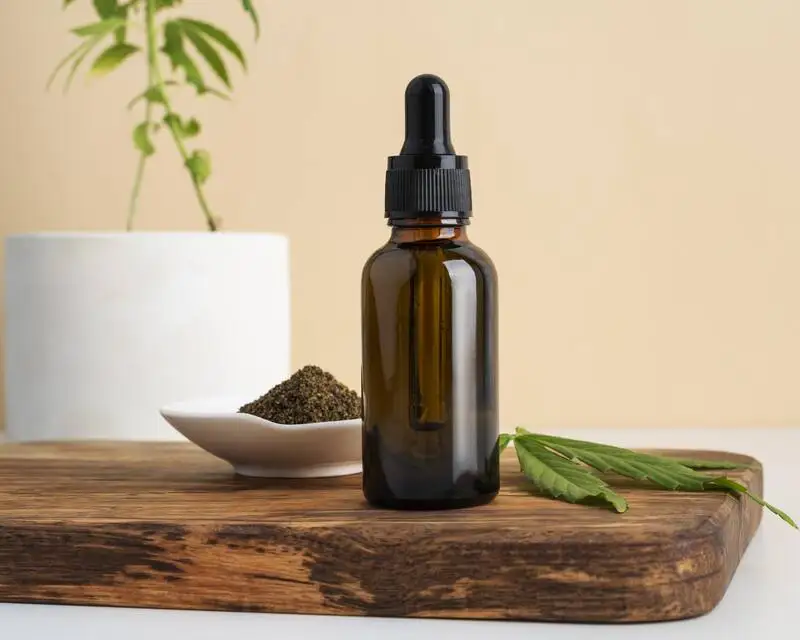
| Tinctures | 5–50 mg per mL | mg per mL | ~20–35% (sublingual); ~10–20% (swallowed) |
A 90% THC vape cartridge is not three times as potent as 30% flower in any straightforward sense. Delivery mechanism, product format, your individual metabolism, and tolerance all mediate the relationship between labeled THC and experienced effect. Edibles are particularly variable because liver metabolism converts THC to 11-hydroxy-THC, a more potent metabolite — which is why even experienced flower consumers can be caught off guard by moderate-dose edibles.
How Potency Testing Works
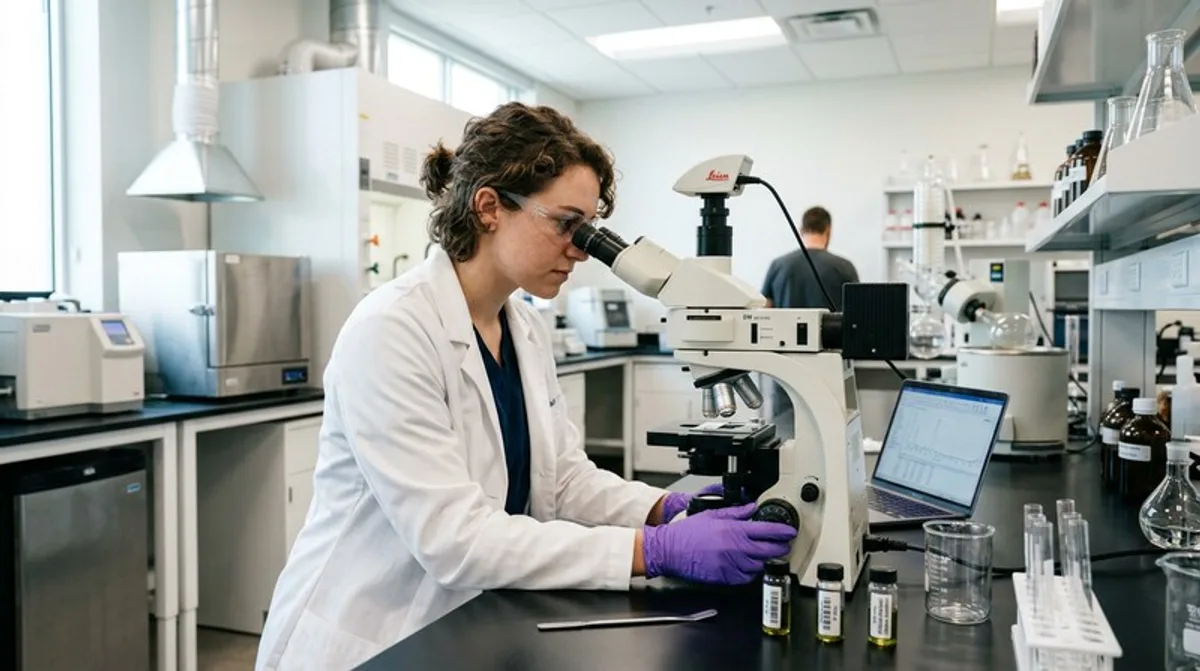
Licensed cannabis products in regulated markets must be tested at accredited laboratories before sale. Two primary analytical methods are used for cannabinoid potency testing:
High-Performance Liquid Chromatography (HPLC). The preferred method for full cannabinoid profiling. HPLC analyzes samples at room temperature, which means THCA is measured as THCA (not pre-converted to THC). This gives a more accurate picture of the raw cannabinoid content of unheated material. HPLC can detect and quantify a broad range of cannabinoids simultaneously.
Gas Chromatography (GC). An older method that requires heating the sample, which converts THCA to THC during the analysis. This produces a direct THC reading but loses the distinction between THCA and THC in the sample. GC is less commonly used for cannabis potency testing today but remains in use in some markets.
The lab variation problem. Independent evaluations of cannabis testing in the US have found significant inconsistency across labs. Studies have documented lab-to-lab THC variation of 15–30% when measuring the same sample. A product that tests at 28% at one lab might test at 22% at another. This is partly a result of methodological differences, sample preparation variation, and — in some documented cases — commercial pressure from producers who prefer labs that return high numbers. Some US states are implementing blind proficiency testing requirements to address this. Treat THC percentages as approximate guides, not precise specifications.
Beginner vs Expert Potency Recommendations
Matching potency to your experience level is one of the most important harm reduction principles in cannabis use. These are general guidelines, not medical advice.
| Experience Level | Flower (THC%) | Edibles (mg) | Notes |
|---|---|---|---|
| Beginner / first time | <15% | 2.5–5 mg | Start with 1–2 inhalations; wait 15 min |
| Moderate experience | 15–20% | 5–10 mg | Standard dispensary recommendation |
| Experienced | 20–28% | 10–25 mg | Established tolerance; knows preferences |
| High tolerance | 28%+ | 25–50+ mg | Daily or near-daily users; concentrates territory |
Why Testing Results Vary
Even setting aside lab variation, THC content is not uniform across a single cannabis plant or harvest batch. Several biological and physical factors contribute to natural variability:
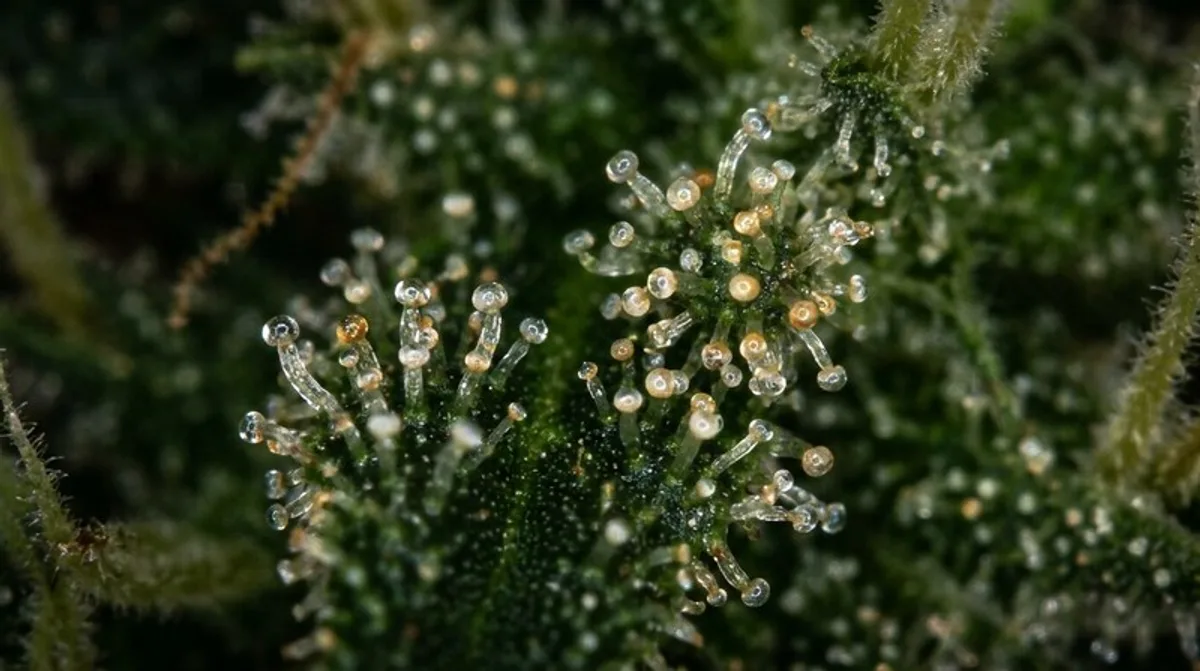
Trichome distribution. Trichome density — and therefore cannabinoid concentration — is highest in the colas and upper flower sites and lower in the inner and lower buds of the same plant. A sample taken from the top of a plant will test differently than one taken from the lower branches. How a batch is sampled for testing has a significant impact on the number returned.
Oxidation of THC to CBN. THC degrades over time through a process of oxidation, converting to cannabinol (CBN). Cannabis that has been improperly stored — exposed to light, heat, or oxygen — will have measurably lower THC than freshly harvested and properly cured material. Products that have been sitting on a shelf for months may have lower actual THC than their label indicates, because potency was measured at the time of testing, not at point of sale.
Moisture content and dry weight. THC percentage is expressed on a dry weight basis. The moisture content of flower at the time of testing directly affects the result. Properly cured cannabis at optimal humidity (58–62% RH) has a specific moisture content that influences the dry weight denominator. Producers who test drier samples will get higher percentage readings for the same absolute THC content.
The Highest-THC Strains
For reference, some of the highest THC measurements recorded on commercial flower include strains such as Godfather OG (tested at 35%+ in some COAs), Ghost Train Haze, and Bruce Banner — all of which represent the extreme upper end of what commercial genetics can produce. For detailed coverage, see our guide to the highest-THC strains tested. Browse all strain data in the strain database. For dosing guidance based on potency, see the THC Dosage Guide.
THC Tolerance and Its Effect on Potency Perception
One of the most consequential and underappreciated variables in THC potency is individual tolerance. CB1 receptor downregulation occurs in response to sustained THC exposure: with regular use, the brain reduces both the number and sensitivity of CB1 receptors, which means the same absolute dose of THC produces progressively less effect.
This tolerance effect is why THC percentage labels have very different practical meanings for different consumers. A cannabis-naive person consuming a single inhalation from a 20% THC strain may experience significant intoxication. A daily consumer may barely notice a full session with the same product. The label has not changed; the receptor system has.
Tolerance is also why chasing higher potency is a losing strategy for regular consumers. Each escalation raises the baseline, requiring even higher doses to achieve the same effect. A structured tolerance break — typically 2–4 weeks of complete abstinence — allows CB1 receptor density to recover substantially. Most regular consumers report significantly enhanced sensitivity after a break, often returning to lower potency products with better results than they achieved with higher-potency products before the break. This is also a meaningful cost and health benefit.
Potency and Drug Testing
A common misconception is that lower-potency cannabis clears drug tests faster than high-potency cannabis. This is partially true: consuming less THC overall means less THC-COOH accumulates in fat stores. However, frequency of use has a far greater impact on detection windows than per-session potency. An occasional user consuming 25% THC will typically clear faster than a daily user consuming 15% THC, because total accumulated fat-stored metabolite load depends primarily on frequency, not on the potency of any single session.
There is also no meaningful difference in drug test detection cutoffs based on the strain used. Standard urine immunoassay tests screen for THC-COOH at 50 ng/mL. Whether that metabolite came from a 15% or a 35% strain is pharmacologically irrelevant once the metabolite is stored in fat. For complete drug testing guidance, see our drug test guide.