
The Light Spectrum and Cannabis Photosynthesis
Light is electromagnetic radiation measured in nanometres (nm). Cannabis photosynthesis is most efficient within the Photosynthetically Active Radiation (PAR) range of 400–700 nm, corresponding to the visible spectrum from violet to red. Outside this range, photons contribute less to carbon fixation and more to heat, although UV and far-red have important signalling roles beyond direct photosynthesis.
The McCree curve — the foundational measurement of quantum yield (photosynthetic efficiency per photon) across wavelengths — shows two primary peaks for higher plants: around 440 nm (blue) and 680 nm (red). Cannabis follows this pattern with particular sensitivity at these wavelengths corresponding to chlorophyll-a and chlorophyll-b absorption maxima. Photons are delivered in quanta; growers measure photon flux density in μmol/m²/s (PPFD) and cumulative daily light integral in mol/m²/day (DLI).
DLI formula: DLI (mol/m²/day) = PPFD (μmol/m²/s) × photoperiod (hours) × 0.0036
Example: 600 μmol/m²/s for 18 hours = 600 × 18 × 0.0036 = 38.9 mol/m²/day DLI
| Wavelength (nm) | Colour | Primary Effect on Cannabis | Recommended Stage |
|---|---|---|---|
| 280–315 | UV-B | Trichome & THCA stress-response; DNA-damage protection pigments | Late flower (last 2–3 weeks) |
| 315–400 | UV-A | Anthocyanin production; mild stress signalling; colour expression | All stages (low dose) |
| 400–500 | Violet & Blue | Compact growth, stomatal regulation, chlorophyll-b peak (430–450 nm) | Seedling & vegetative |
| 500–570 | Green | Canopy penetration; lower-leaf photosynthesis; carotenoid absorption | All stages |
| 570–620 | Yellow & Orange | Moderate photosynthesis; less efficient than red/blue | All stages (background) |
| 620–700 | Red | Highest photosynthetic efficiency; chlorophyll-a peak (640–680 nm); flowering trigger | Flower (dominant wavelength) |
| 700–750 | Far-Red | Phytochrome FR conversion; Emerson enhancement; accelerated flower timing | End-of-day pulse; late flower |
Vegetative Stage Lighting
During vegetative growth, cannabis benefits from a blue-dominant spectrum that mirrors natural summer daylight, characterised by higher proportions of short-wavelength blue light due to the sun’s higher overhead angle. Blue light (400–500 nm) regulates several key growth mechanisms: phototropism (directed stem growth), stomatal opening (CO2 uptake efficiency), chloroplast movement, and the cryptochrome/phototropin signalling pathways that promote compact, bushy node development.
Plants grown under blue-dominant light during veg exhibit shorter internodal spacing, thicker stems with stronger cell walls, and wider leaf angles for better canopy coverage. This is the morphological foundation for maximising light interception during flowering. Switching to red-heavy spectrum too early in veg produces stretched, weak structure that underperforms in flower.
Recommended vegetative parameters:
- Photoperiod: 18 hours light / 6 hours dark (18/6) for photoperiod varieties; 20/4 acceptable
- PPFD: 400–600 μmol/m²/s at canopy level for established veg plants; 200–400 for seedlings
- DLI target: 25–38 mol/m²/day
- Spectrum: 5,000–7,000 K colour temperature equivalent; ≥30% blue component
- Hanging height: Follow manufacturer’s PPFD chart; measure with quantum PAR meter, not estimates
Metal Halide (MH) lamps have historically been the vegetative-stage standard with their blue-heavy 4,000–5,000 K spectrum. Modern blue-channel-enhanced LED quantum boards replicate and improve on this spectrum with far greater efficacy. At 600 PPFD, an MH lamp at 1.1 μmol/J requires ~545 watts, while a quality LED at 2.8 μmol/J achieves the same at ~215 watts — a 60% electricity reduction for identical plant-level output.
Flowering Stage Lighting
The transition from vegetative to flowering is triggered in photoperiod cannabis by a shift to 12 hours of uninterrupted darkness (12/12 photoperiod). At the cellular level, phytochrome B (Pr form, absorbs red 660 nm) converts to phytochrome FR (Pfr form) under red light during the day. The extended dark period allows Pfr to revert to Pr, reaching a threshold that signals the plant to initiate reproductive development. This is why even brief light interruptions during the dark period reset the flowering clock.
Once flowering is underway, red-dominant spectrum at 620–700 nm drives the highest photosynthetic rates and supports the metabolic demands of bud development. PPFD requirements increase significantly from veg — mature cannabis in flower can utilise 800–1,200 μmol/m²/s under adequate CO2 (1,000+ ppm).
Recommended flowering parameters:
- Photoperiod: 12/12 (photoperiod strains); maintain 18/6 or 20/4 for autoflowers throughout
- PPFD: 600–900 μmol/m²/s at canopy; up to 1,200 with supplemental CO2
- DLI target: 38–55 mol/m²/day
- Spectrum: Shift to warmer, red-dominant ratio (2,700–3,500 K equivalent); ≥30% red component
- Far-red end-of-day pulse: 5–15 minutes of 730 nm immediately after lights-off; accelerates transition and can reduce total flower time
Far-red end-of-day (EOD) protocol: The Emerson enhancement effect describes a synergistic increase in photosynthesis when 660 nm red and 730 nm far-red are used simultaneously or sequentially. In practical terms, a 5–15 minute exposure to far-red-only light immediately after the main lights turn off converts remaining Pfr (active phytochrome) to the Pr form more completely, deepening the dark-period signal and accelerating the flowering response. Commercial LED controllers increasingly include programmable EOD far-red pulses. Studies suggest cycle reduction of 5–14 days is achievable.
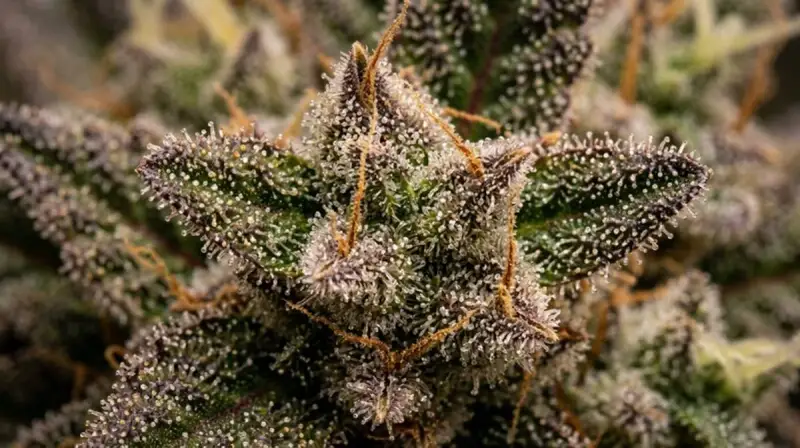
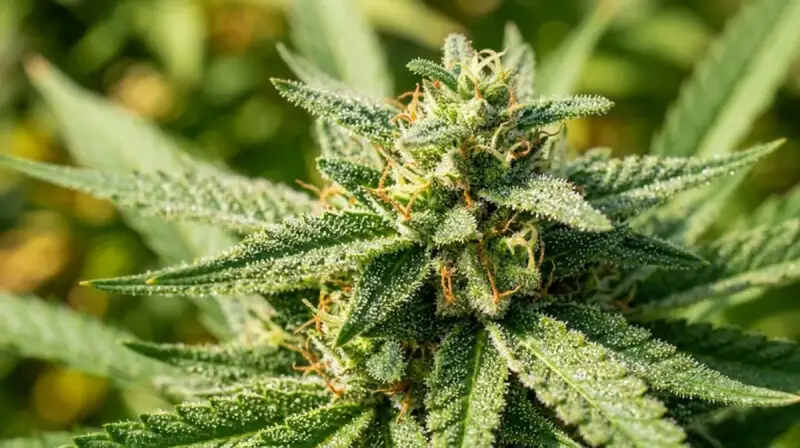
UV and Infrared: Trichome Enhancement
Trichomes are the resin glands that produce cannabinoids and terpenes. They evolved as a defense mechanism — the sticky, odorous resin repels insects, traps them, and provides UV-B screening to protect reproductive tissues. Growers can exploit this defence response by supplementing UV-B during the final weeks of flowering to stimulate increased trichome density, THCA synthase activity, and terpene secretion.
The THCA biosynthesis pathway: Geranyl pyrophosphate + olivetolic acid → CBGA (via GOT enzyme) → THCA (via THCA synthase). UV-B stress upregulates THCA synthase gene expression. Flavonoids (cannaflafin-1 and -2) and anthocyanins also increase under UV stress, potentially contributing to entourage pharmacology.
Practical UV-B supplementation protocol:
- Start: 2–3 weeks before planned harvest date (typically week 6 of flower for 8-week strains)
- Duration: 2 hours per light cycle, mid-day (not at the start or end of the photoperiod)
- Intensity: 50–100 mW/m² UV-B at canopy level; use a UV meter, not estimates
- Source: Reptile UV-B T5 fluorescents (e.g., Arcadia 12% UVB) or dedicated horticultural UV-B bars
- Safety: Never look directly at UV-B sources; cover skin; fit timer to prevent extended exposure
- Cutoff: Stop UV-B 5–7 days before harvest to allow any UV-stressed leaf tissue to recover
Overexposure to UV-B causes bleaching of trichome heads (photo-oxidative degradation of THCA), leaf tissue damage, and accelerated senescence. The goal is stress without damage. Start with shorter sessions (1 hour) and monitor the canopy for signs of bleaching before extending duration.
LED vs. HPS vs. CMH: Complete Spectrum Comparison
Choosing the right light technology is one of the highest-impact decisions in setting up a cannabis grow. Each technology has a distinct spectrum profile, efficiency characteristic, thermal footprint, and cost curve. There is no single “best” technology independent of context — a small tent grower in a cold climate benefits differently from LED than a large-scale commercial grower in a hot environment.
| Technology | Spectrum Quality | Efficacy (μmol/J) | Heat Output | Upfront Cost | Best Use Case |
|---|---|---|---|---|---|
| Quantum Board LED | Full spectrum + UV/IR options; adjustable ratio | 2.5–3.5 | Low (most heat radiated, not convective) | High ($$$) | All sizes; best efficiency over time; hot climates |
| COB LED | Full spectrum; intense point sources; variable CRI | 1.8–2.6 | Medium–High (heatsinks required) | Medium-High ($$–$$$) | Small–medium grows; DIY builds |
| HPS (High-Pressure Sodium) | Yellow-orange dominant (2,100 K); lacks blue; poor spectrum for veg | 1.0–1.7 | Very High (convective; raises ambient temp significantly) | Low ($) | Large commercial grows; cold climates (heat benefit); established operations |
| MH (Metal Halide) | Blue-heavy (4,000–6,000 K); good for veg; poor for flower | 0.9–1.4 | Very High | Low ($) | Vegetative only; HID legacy grows |
| CMH / LEC (315W) | Excellent full spectrum; highest CRI of any HID; natural UV output | 1.7–2.1 | Medium | Medium ($$) | Small–medium grows; best HID alternative; natural UV without supplementation |
| T5 Fluorescent | Good spectrum (various K); low intensity | 0.8–1.2 | Very Low | Very Low ($) | Clones; seedlings; mother plants; UV-B supplementation |
DLI Calculator and Light Schedule Optimisation
Daily Light Integral (DLI) is the single most useful number for optimising cannabis light schedules. It expresses the cumulative photon dose delivered to the canopy per square metre per day. DLI integrates both PPFD intensity and photoperiod duration, allowing direct comparison between different light schedules.
Target DLI ranges by stage:
- Seedlings / clones: 12–20 mol/m²/day (high DLI causes photoinhibition in young plants)
- Vegetative: 25–38 mol/m²/day
- Early flower: 38–45 mol/m²/day
- Peak flower: 45–55 mol/m²/day (with 1,000+ ppm CO2 enrichment; plants hit light saturation above ~900 μmol without CO2)
Light saturation point: Cannabis reaches its light saturation point (LSP) — where additional photons produce no additional photosynthesis — at approximately 600–900 μmol/m²/s at ambient CO2 (400 ppm). With CO2 enrichment to 1,200–1,500 ppm, LSP rises to approximately 1,200–1,500 μmol/m²/s. Running lights above LSP without CO2 enrichment wastes electricity and generates heat without yield benefit.
PPFD measurement and placement: Always use a dedicated quantum PAR sensor (not a lux meter — lux measures human visual brightness, not photon flux). Take measurements at 9 points across the canopy (3×3 grid) and calculate the average and the uniformity ratio (minimum/average). A uniformity ratio above 0.7 is considered adequate; 0.85+ is excellent.
Inverse square law: PPFD falls with the square of distance from the light source: halving the hanging height quadruples the PPFD; doubling it reduces PPFD to one quarter. This is why manufacturer PPFD charts specify a precise hanging height — changing that height by 20 cm significantly affects actual delivered intensity.
SCROG (Screen of Green) under LED: A horizontal scrog net at a fixed canopy height allows growers to maintain a uniform canopy at the optimal distance from a quantum board LED, maximising PPFD uniformity across the entire footprint. LED quantum boards are particularly suited to SCROG because their even light distribution (vs. the central hotspot of HPS) eliminates “sweet spots” and delivers consistent DLI to every bud site. Train branches through the net during late veg; flip to 12/12 when the screen is 60–70% full.